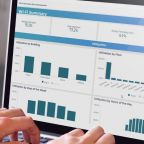
In recent years, there has been an explosion in business intelligence tools. Reporting and graphs have been a mainstay for decades, yet business intelligence (BI) is the next phase of power reporting. Applications such as Domo, Exago, Google Data Studio, Microsoft PowerBI, Qlik, Tableau and more have taken the marketplace by storm. The reason? Traditional reporting can only handle so many varieties of data vs. BI that can collect and visualize extensive amounts of semi-related data into a manageable display. Often, data can be filtered on-the-spot and the results (usually multiple panes of graphs, key performance indicators and data lists) adjust according to the filter.
BI dashboards often speak to managers and executives. A software platform can have dozens of reports, yet often a singular dashboard with 6 or less visuals is what will resonate to leadership that has a variety of departments they monitor. When considering a dashboard, you will have a plethora of data, but what will resonate to those not in your department every day is what you will need to consider.
What Should I Consider in a BI Dashboard for Maintenance and Services?
Maintenance Dashboards for team and ticket management provide supervisors and leadership with advanced visibility into how service requests are being processed and actioned upon. How much is open vs. closed? What trends are occurring over time? Are there areas or job types that have more needs than others?
Dashboards align departmental facilities goals and organizational priorities by tracking work performance against KPIs with intuitive reporting. Dashboards are the foundation of data-driven decisions on resource allocation and critical areas of need by monitoring trends around submission, completion and priorities. When it comes to maintaining the ideal workspace, every ticket counts when you are a maintenance manager and knowing your overall organization is operating with efficiency and efficacy counts when you are an executive.
Your focus is to understand team performance and improve the employee experience with maintenance dashboards. As you understand more by measuring, you can set goals, make projections and adjust as needed. By doing so, you keep your organization running smoothly by eliminating costly inefficiencies and communicating effectively to business leaders, key executives and stakeholders. When you provide full metrics transparently, you can guarantee your entire facility team and your leadership is on the same page.
How Should I React to a Dashboard?
A CEO once told me, “A number is just a number. How you react, interpret and frame it in a story is what’s important.” I think of data as objective and a person’s experiences as subjective. You need both to understand what is occurring.
Do you need to hire more people? If you speak with leadership about hiring, they’ll ask how many and for what reason. Your subjective gut instinct may say two, objective data may prove four. You started with an idea and proved it with data. Data also helps with what skill sets are needed (e.g., electrical is a major area of work where you have a backlog) and you know what type of cultural fit a candidate should have in your workplace.
Sometimes you may see what appears as a technician who is falling behind because they have more open work order tasks and dispatches than others. What does this mean? That is where you need the subjective side. Maybe they do not know the process of closing work. Maybe they are overloaded. Maybe it’s an old facility full of old equipment. Maybe they are constantly waiting on parts. Maybe they have personal issues affecting their work life. Maybe they are helping others so much it affects their KPIs. Maybe they are illiterate, or perhaps English is a second language.
In closing, if you give an opinion without giving information, it may not be involved in the final decision. If you only look at the numbers and do not understand the story, you miss out on leadership opportunities. Business intelligence data balanced with intelligent business management are shaping the next evolution in the facility management and operations profession.
How Can I Learn More?
Tune into our recorded webcast that explored these new features to our maintenance solutions, including facility maintenance dashboards that provides supervisors with advanced visibility in to how service requests are being processed and actioned on. You will learn how maintenance dashboards enable organizations to make data-driven decisions on resource allocation and critical areas of need by monitoring submission and priority trends.


